Occupational Therapy Assistant Salary in California: $86,277 (2026)
Quick Answer:Across California's 157 metropolitan areas, the average median occupational therapy assistant pay sits at $86,277/year heading into 2026 — a figure projected from 2025 BLS OEWS wage data for SOC 31-2011. Because California sits at BEA RPP 113.1 (13% above the U.S. baseline), that statewide median translates to roughly $76,284 in nationally-comparable purchasing power. Highest-paying metros: Oakland ($100,087), Fremont ($97,880), San Francisco ($97,860).
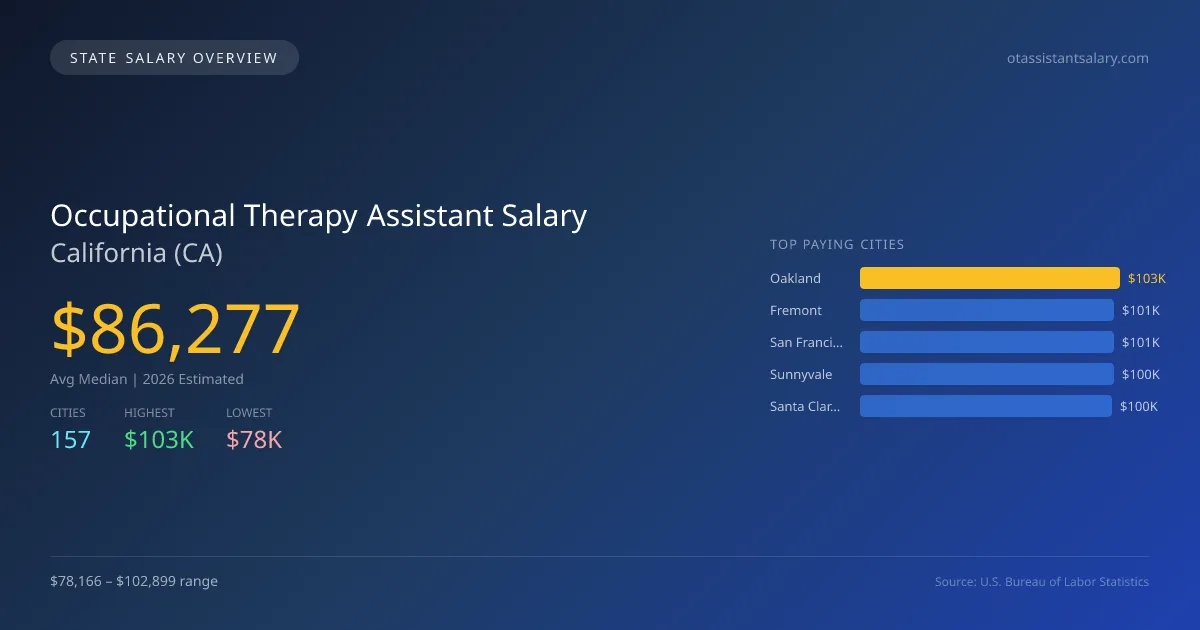
In California, the projected average median salary for occupational therapy assistants in 2026 stands at $86,276, which is significantly higher than the national median of $74,332, representing a difference of 16.1%. Salaries across different cities show considerable variation; for instance, Oakland leads with an average salary of $102,899, while Fresno sits at the lower end with $78,166, highlighting a gap of $24,733. This disparity is often driven by factors such as local demand for services, cost of living, and availability of skilled practitioners. To practice in California, occupational therapy assistants must adhere to specific licensing requirements and state regulations that govern their scope of practice. The demand for these professionals is fueled by an aging population and an increasing emphasis on rehabilitation services, contributing to a projected annual growth rate of 2.81%. With a total employment figure of 6,710 occupational therapy assistants across the state, cities such as Fremont ($100,630), San Francisco ($100,610), Sunnyvale ($100,352), and Santa Clara ($99,693) are also expected to offer competitive salaries. The overall job market for occupational therapy assistants in California shows a strong outlook, driven by continued growth in the healthcare sector and increasing recognition of the importance of occupational therapy services.
California Occupational Therapy Assistant Salary Range
Overall salary range in California: $52,253 (lowest entry-level) to $135,109 (highest top earner)
California vs National Average
California occupational therapy assistants earn 16.07% more than the national median (+$11,945/year difference).
California Occupational Therapy Assistant Salary Distribution (2026)
Occupational Therapy Assistant salaries in California range from $65,895 (entry-level, 10th percentile) to $109,511 (top earners, 90th percentile), with a median of $86,277. The California median is $11,945 above the US national median of $74,332. The average hourly rate is $41.48/hr. Approximately 6,710 occupational therapy assistants are employed across 157 cities.
2019 BLS Actual
$70,956
2025 BLS Actual
$83,918
2026 Current Est.
$86,277
2019–2027 Growth
+25.0%
Salary Trajectory for Occupational Therapy Assistants in California (2019–2027)
2019–2025: actual BLS OEWS data for this metro area. 2026+: CAGR 2.81% projection.
| Year | Annual Salary | Status |
|---|---|---|
| 2019 | $70,956 | Actual |
| 2020 | $74,250 | Actual |
| 2021 | $78,403 | Actual |
| 2022 | $80,690 | Actual |
| 2023 | $81,954 | Actual |
| 2024 | $86,208 | Actual |
| 2025 | $83,918 | Actual |
| 2026(current) | $86,277 | Estimated |
| 2027 | $88,701 | Projected |
Based on 7 years of BLS OEWS data for the California metropolitan area, the median occupational therapy assistant salary grew 18.3% from $70,956 (2019) to $83,918 (2025). At a 2.81% compound annual growth rate, salaries are projected to reach $88,701 by 2027 — a total increase of $17,745 (25.01%) from 2019.
Note: Historical values (2019–2025) are actual BLS OEWS figures for the California metropolitan area, sourced from annual Occupational Employment and Wage Statistics surveys. 2026–2026 figures are current estimates, and 2027 values are projections, calculated using a 2.81% CAGR derived from 7-year BLS historical data. Actual salaries may vary based on employer, experience, certifications, and local market conditions.
Top 5 Highest Paying Cities in California
Lowest Paying Cities in California
| City | Median Salary |
|---|---|
| Fresno | $78,166 |
| Los Angeles | $80,284 |
| Long Beach | $80,551 |
| Anaheim | $81,713 |
| Riverside | $82,320 |
Best Value Cities for Occupational Therapy Assistants in California
When adjusted for local cost of living, these California cities offer the most purchasing power for occupational therapy assistants.
| City | Nominal Salary | CoL Index | Adjusted Salary |
|---|---|---|---|
| Bakersfield | $97,865 | 100.886 | $97,006 |
| Modesto | $98,914 | 104.108 | $95,011 |
| Sacramento | $97,855 | 106.67 | $91,736 |
| Oakland | $102,899 | 113.1 | $90,981 |
| Fremont | $100,630 | 113.1 | $88,974 |
Adjusted salary = nominal salary × (100 / CoL index). CoL index: 100 = national average. Lower index = lower cost of living.
Salary by Experience Level in California
| Experience Level | Estimated Annual |
|---|---|
| Entry Level (0-2 years) | $65,895 |
| Mid Career (3-7 years) | $86,277 |
| Experienced (7+ years) | $109,511 |
Estimates based on BLS percentile data averaged across California metro areas. Individual pay varies by employer, certifications, and specialization.
All 157 Cities in California
| # | City | Median Salary |
|---|---|---|
| 1 | Oakland | $102,899 |
| 2 | Fremont | $100,630 |
| 3 | San Francisco | $100,610 |
| 4 | Sunnyvale | $100,352 |
| 5 | Santa Clara | $99,693 |
| 6 | Modesto | $98,914 |
| 7 | Folsom | $98,516 |
| 8 | San Jose | $98,050 |
| 9 | Bakersfield | $97,865 |
| 10 | Sacramento | $97,855 |
| 11 | Roseville | $97,452 |
| 12 | Santa Ana | $91,938 |
| 13 | Fontana | $90,236 |
| 14 | Irvine | $90,138 |
| 15 | Pomona | $89,698 |
| 16 | Simi Valley | $89,648 |
| 17 | Escondido | $89,627 |
| 18 | Fairfield | $89,465 |
| 19 | Fullerton | $89,136 |
| 20 | Daly City | $89,059 |
| 21 | El Monte | $89,031 |
| 22 | Vista | $88,982 |
| 23 | Concord | $88,960 |
| 24 | Santa Maria | $88,869 |
| 25 | Clovis | $88,828 |
| 26 | Garden Grove | $88,736 |
| 27 | Temecula | $88,716 |
| 28 | Santa Clarita | $88,656 |
| 29 | Lancaster | $88,540 |
| 30 | Inglewood | $88,540 |
| 31 | Corona | $88,428 |
| 32 | Richmond | $88,415 |
| 33 | Rialto | $88,372 |
| 34 | Torrance | $88,260 |
| 35 | Salinas | $88,162 |
| 36 | Elk Grove | $88,092 |
| 37 | Oceanside | $88,070 |
| 38 | Whittier | $88,044 |
| 39 | San Rafael | $88,038 |
| 40 | Rancho Cucamonga | $87,958 |
| 41 | Hayward | $87,910 |
| 42 | Woodland | $87,886 |
| 43 | Buena Park | $87,873 |
| 44 | Encinitas | $87,866 |
| 45 | Downey | $87,860 |
| 46 | Dublin | $87,811 |
| 47 | Redlands | $87,783 |
| 48 | Chino | $87,735 |
| 49 | Westminster | $87,708 |
| 50 | Santa Monica | $87,701 |
| 51 | San Mateo | $87,692 |
| 52 | Tulare | $87,667 |
| 53 | San Buenaventura | $87,636 |
| 54 | Mission Viejo | $87,578 |
| 55 | Moreno Valley | $87,577 |
| 56 | Pleasanton | $87,563 |
| 57 | Pasadena | $87,440 |
| 58 | Santee | $87,378 |
| 59 | Glendale | $87,299 |
| 60 | Mountain View | $87,255 |
| 61 | Pittsburg | $87,248 |
| 62 | Novato | $87,220 |
| 63 | Costa Mesa | $87,187 |
| 64 | Berkeley | $87,095 |
| 65 | Huntington Beach | $87,075 |
| 66 | Jurupa Valley | $86,998 |
| 67 | Hemet | $86,972 |
| 68 | Union City | $86,966 |
| 69 | West Covina | $86,956 |
| 70 | Chino Hills | $86,931 |
| 71 | Chico | $86,816 |
| 72 | Gilroy | $86,808 |
| 73 | Santa Cruz | $86,780 |
| 74 | Stockton | $86,772 |
| 75 | San Marcos | $86,759 |
| 76 | Tustin | $86,684 |
| 77 | San Ramon | $86,677 |
| 78 | Eastvale | $86,595 |
| 79 | Murrieta | $86,591 |
| 80 | Vacaville | $86,591 |
| 81 | Brentwood | $86,554 |
| 82 | Hesperia | $86,513 |
| 83 | Lake Elsinore | $86,505 |
| 84 | Citrus Heights | $86,395 |
| 85 | El Cajon | $86,318 |
| 86 | San Clemente | $86,293 |
| 87 | Bellflower | $86,258 |
| 88 | Palmdale | $86,220 |
| 89 | La Mirada | $86,219 |
| 90 | Apple Valley | $86,203 |
| 91 | Menifee | $86,177 |
| 92 | Yucaipa | $86,141 |
| 93 | Norwalk | $86,135 |
| 94 | Yuba City | $86,100 |
| 95 | Rancho Cordova | $86,058 |
| 96 | Montebello | $85,976 |
| 97 | Compton | $85,942 |
| 98 | Vallejo | $85,891 |
| 99 | Porterville | $85,880 |
| 100 | Lompoc | $85,869 |
| 101 | Hawthorne | $85,735 |
| 102 | Antioch | $85,708 |
| 103 | Burbank | $85,700 |
| 104 | Santa Rosa | $85,595 |
| 105 | Lodi | $85,574 |
| 106 | Redding | $85,564 |
| 107 | Napa | $85,543 |
| 108 | Alhambra | $85,502 |
| 109 | Livermore | $85,502 |
| 110 | Orange | $85,476 |
| 111 | South Gate | $85,474 |
| 112 | Victorville | $85,456 |
| 113 | West Sacramento | $85,426 |
| 114 | Poway | $85,404 |
| 115 | San Leandro | $85,289 |
| 116 | Indio | $85,192 |
| 117 | Lake Forest | $85,192 |
| 118 | Chula Vista | $85,102 |
| 119 | Petaluma | $85,082 |
| 120 | Carson | $85,041 |
| 121 | Rocklin | $85,028 |
| 122 | San Diego | $85,003 |
| 123 | Newport Beach | $84,883 |
| 124 | Redwood City | $84,877 |
| 125 | Turlock | $84,856 |
| 126 | Manteca | $84,829 |
| 127 | Perris | $84,821 |
| 128 | Madera | $84,752 |
| 129 | Baldwin Park | $84,601 |
| 130 | Palo Alto | $84,601 |
| 131 | Lakewood | $84,567 |
| 132 | San Luis Obispo | $84,556 |
| 133 | Hanford | $84,396 |
| 134 | Oxnard | $84,366 |
| 135 | Beaumont | $84,320 |
| 136 | Merced | $84,306 |
| 137 | Tracy | $84,299 |
| 138 | Carlsbad | $84,293 |
| 139 | Alameda | $84,271 |
| 140 | Laguna Niguel | $84,251 |
| 141 | Milpitas | $84,210 |
| 142 | Camarillo | $84,031 |
| 143 | Thousand Oaks | $84,025 |
| 144 | Oakley | $83,997 |
| 145 | Davis | $83,976 |
| 146 | Upland | $83,915 |
| 147 | La Habra | $83,791 |
| 148 | Lynwood | $83,756 |
| 149 | Visalia | $83,482 |
| 150 | Ontario | $83,429 |
| 151 | San Bernardino | $82,422 |
| 152 | Brea | $82,327 |
| 153 | Riverside | $82,320 |
| 154 | Anaheim | $81,713 |
| 155 | Long Beach | $80,551 |
| 156 | Los Angeles | $80,284 |
| 157 | Fresno | $78,166 |
More California Salary Data
Hourly Rates
Explore occupational therapy assistant hourly pay in California cities.
Entry Level
Starting salaries for new occupational therapy assistants.
Senior / Experienced
Top earner salaries for experienced occupational therapy assistants.
Compare Cities in California
View all comparisons →Explore More Occupational Therapy Assistant Salary Data
Frequently Asked Questions
How much do occupational therapy assistants make in California in 2026?
What is the highest paying city for occupational therapy assistants in California?
How does California occupational therapy assistant pay compare to the national average?
What is the entry-level occupational therapy assistant salary in California?
How many occupational therapy assistants are employed in California?
Which California city offers the best value for occupational therapy assistants?
Written by Jordan Lee, MS, OTR/L
Career Analyst
Jordan Lee has 10 years of experience as an occupational therapist. Their specialty is working with children with developmental disorders. They have worked in various healthcare settings including schools and rehabilitation facilities.
Methodology & Data Source
Statewide salary figures on this page are 2026 projections based on the Bureau of Labor Statistics Occupational Employment and Wage Statistics (OEWS) survey, May 2026 release. A 2.81% compound annual growth rate (CAGR), derived from 6-year national BLS wage trends, was applied to each metro area's reported salary to estimate current 2026 occupational therapy assistant compensation across California. State averages are employment-weighted across 157 metro areas — larger metro areas with more occupational therapy assistantscontribute proportionally more to the average, producing figures that better reflect typical compensation. Individual pay varies by city, employer, certifications, and experience.
Data Sources & Methodology
Source: BLS, OEWS, 7-year dataset (–). Per-city data from annual BLS metropolitan area surveys.
2026 figures are projected from 2025 BLS data using a compound annual growth rate (CAGR) of 2.81%, derived from historical BLS wage trends for occupational therapy assistants (SOC 31-2011).
Compiled and verified by Jordan Lee, MS, OTR/L, a licensed occupational therapy assistant with 10+ years of clinical experience. · View source data at BLS.gov