Occupational Therapy Assistant Salary in Indiana: $69,273 (2026)
Quick Answer:Across Indiana's 43 metropolitan areas, the average median occupational therapy assistant pay sits at $69,273/year heading into 2026 — a figure projected from 2025 BLS OEWS wage data for SOC 31-2011. Because Indiana sits at BEA RPP 91.3 (9% below the U.S. baseline), that statewide median translates to roughly $75,874 in nationally-comparable purchasing power. Highest-paying metros: Fort Wayne ($73,130), Lafayette ($71,930), West Lafayette ($70,805).
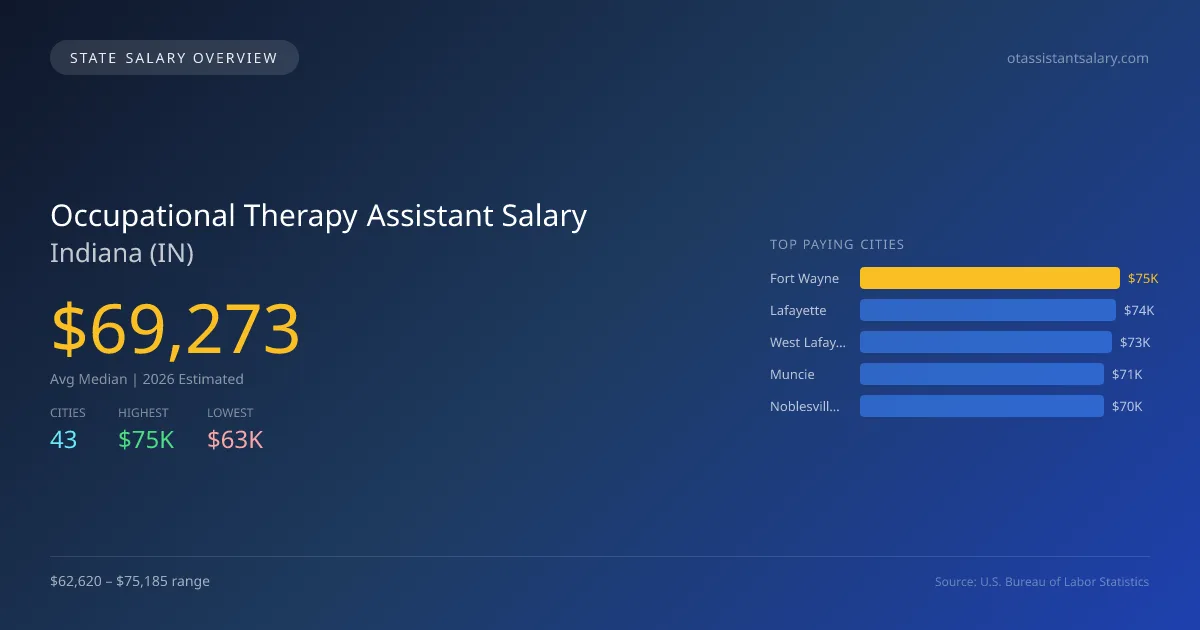
In 2026, the average median salary for occupational therapy assistants in Indiana is projected to be $69,273, which is approximately 6.8% lower than the national median of $74,332. The salary range varies significantly across the state, with Fort Wayne offering the highest average at $75,185 and Mishawaka at the lower end with $62,620. This difference can be attributed to local demand for services, cost of living variations, and the concentration of healthcare facilities in particular areas. Indiana has specific licensing requirements for occupational therapy assistants that must be met, including completion of an accredited program and passing a national certification exam. The state's scope of practice laws define the responsibilities of occupational therapy assistants, influencing employment opportunities. With a projected growth rate of 2.81% in this field, demand for occupational therapy services is driven by an aging population and increasing awareness of rehabilitation needs. Currently, the employment landscape includes approximately 1,407 occupational therapy assistants. Key cities poised for growth include Lafayette at $73,951, West Lafayette at $72,795, Muncie at $70,658, and Noblesville at $70,438. These factors contribute to a favorable outlook for occupational therapy assistants in Indiana.
Indiana Occupational Therapy Assistant Salary Range
Overall salary range in Indiana: $39,510 (lowest entry-level) to $92,395 (highest top earner)
Indiana vs National Average
Indiana occupational therapy assistants earn 6.81% less than the national median ($-5,059/year difference).
Indiana Occupational Therapy Assistant Salary Distribution (2026)
Occupational Therapy Assistant salaries in Indiana range from $44,912 (entry-level, 10th percentile) to $86,635 (top earners, 90th percentile), with a median of $69,273. The Indiana median is $5,059 below the US national median of $74,332. The average hourly rate is $33.30/hr. Approximately 1,407 occupational therapy assistants are employed across 43 cities.
2019 BLS Actual
$53,675
2025 BLS Actual
$67,380
2026 Current Est.
$69,273
2019–2027 Growth
+32.7%
Salary Trajectory for Occupational Therapy Assistants in Indiana (2019–2027)
2019–2025: actual BLS OEWS data for this metro area. 2026+: CAGR 2.81% projection.
| Year | Annual Salary | Status |
|---|---|---|
| 2019 | $53,675 | Actual |
| 2020 | $51,255 | Actual |
| 2021 | $50,200 | Actual |
| 2022 | $52,475 | Actual |
| 2023 | $54,194 | Actual |
| 2024 | $60,602 | Actual |
| 2025 | $67,380 | Actual |
| 2026(current) | $69,273 | Estimated |
| 2027 | $71,220 | Projected |
Based on 7 years of BLS OEWS data for the Indiana metropolitan area, the median occupational therapy assistant salary grew 25.5% from $53,675 (2019) to $67,380 (2025). At a 2.81% compound annual growth rate, salaries are projected to reach $71,220 by 2027 — a total increase of $17,545 (32.69%) from 2019.
Note: Historical values (2019–2025) are actual BLS OEWS figures for the Indiana metropolitan area, sourced from annual Occupational Employment and Wage Statistics surveys. 2026–2026 figures are current estimates, and 2027 values are projections, calculated using a 2.81% CAGR derived from 7-year BLS historical data. Actual salaries may vary based on employer, experience, certifications, and local market conditions.
Top 5 Highest Paying Cities in Indiana
Lowest Paying Cities in Indiana
| City | Median Salary |
|---|---|
| Mishawaka | $62,620 |
| South Bend | $63,434 |
| Munster | $64,099 |
| Avon | $65,482 |
| Brownsburg | $65,950 |
Best Value Cities for Occupational Therapy Assistants in Indiana
When adjusted for local cost of living, these Indiana cities offer the most purchasing power for occupational therapy assistants.
| City | Nominal Salary | CoL Index | Adjusted Salary |
|---|---|---|---|
| Fort Wayne | $75,185 | 92.572 | $81,218 |
| West Lafayette | $72,795 | 91.3 | $79,732 |
| Lafayette | $73,951 | 93.43 | $79,151 |
| Elkhart | $70,147 | 90.325 | $77,661 |
| Muncie | $70,658 | 91.3 | $77,391 |
Adjusted salary = nominal salary × (100 / CoL index). CoL index: 100 = national average. Lower index = lower cost of living.
Salary by Experience Level in Indiana
| Experience Level | Estimated Annual |
|---|---|
| Entry Level (0-2 years) | $44,912 |
| Mid Career (3-7 years) | $69,273 |
| Experienced (7+ years) | $86,635 |
Estimates based on BLS percentile data averaged across Indiana metro areas. Individual pay varies by employer, certifications, and specialization.
All 43 Cities in Indiana
| # | City | Median Salary |
|---|---|---|
| 1 | Fort Wayne | $75,185 |
| 2 | Lafayette | $73,951 |
| 3 | West Lafayette | $72,795 |
| 4 | Muncie | $70,658 |
| 5 | Noblesville | $70,438 |
| 6 | Terre Haute | $70,355 |
| 7 | Elkhart | $70,147 |
| 8 | Gary | $69,754 |
| 9 | Fishers | $69,500 |
| 10 | Indianapolis | $69,181 |
| 11 | Goshen | $69,157 |
| 12 | Bloomington | $69,047 |
| 13 | Plainfield | $68,842 |
| 14 | Valparaiso | $68,717 |
| 15 | Columbus | $68,642 |
| 16 | Kokomo | $68,611 |
| 17 | Carmel | $68,575 |
| 18 | Westfield | $68,496 |
| 19 | Franklin | $68,485 |
| 20 | Schererville | $68,334 |
| 21 | Anderson | $68,093 |
| 22 | Evansville | $68,060 |
| 23 | Richmond | $67,793 |
| 24 | Hammond | $67,762 |
| 25 | Greenwood | $67,745 |
| 26 | Marion | $67,328 |
| 27 | Portage | $67,290 |
| 28 | East Chicago | $67,258 |
| 29 | New Albany | $67,247 |
| 30 | Jeffersonville | $67,117 |
| 31 | Zionsville | $66,928 |
| 32 | Hobart | $66,902 |
| 33 | Merrillville | $66,825 |
| 34 | Granger | $66,804 |
| 35 | Lawrence | $66,647 |
| 36 | Crown Point | $66,371 |
| 37 | Shelbyville | $66,352 |
| 38 | Michigan City | $66,253 |
| 39 | Brownsburg | $65,950 |
| 40 | Avon | $65,482 |
| 41 | Munster | $64,099 |
| 42 | South Bend | $63,434 |
| 43 | Mishawaka | $62,620 |
More Indiana Salary Data
Hourly Rates
Explore occupational therapy assistant hourly pay in Indiana cities.
Entry Level
Starting salaries for new occupational therapy assistants.
Senior / Experienced
Top earner salaries for experienced occupational therapy assistants.
Compare Cities in Indiana
View all comparisons →Explore More Occupational Therapy Assistant Salary Data
Frequently Asked Questions
How much do occupational therapy assistants make in Indiana in 2026?
What is the highest paying city for occupational therapy assistants in Indiana?
How does Indiana occupational therapy assistant pay compare to the national average?
What is the entry-level occupational therapy assistant salary in Indiana?
How many occupational therapy assistants are employed in Indiana?
Which Indiana city offers the best value for occupational therapy assistants?
Written by Jordan Lee, MS, OTR/L
Career Analyst
Jordan Lee has 10 years of experience as an occupational therapist. Their specialty is working with children with developmental disorders. They have worked in various healthcare settings including schools and rehabilitation facilities.
Methodology & Data Source
Statewide salary figures on this page are 2026 projections based on the Bureau of Labor Statistics Occupational Employment and Wage Statistics (OEWS) survey, May 2026 release. A 2.81% compound annual growth rate (CAGR), derived from 6-year national BLS wage trends, was applied to each metro area's reported salary to estimate current 2026 occupational therapy assistant compensation across Indiana. State averages are employment-weighted across 43 metro areas — larger metro areas with more occupational therapy assistantscontribute proportionally more to the average, producing figures that better reflect typical compensation. Individual pay varies by city, employer, certifications, and experience.
Data Sources & Methodology
Source: BLS, OEWS, 7-year dataset (–). Per-city data from annual BLS metropolitan area surveys.
2026 figures are projected from 2025 BLS data using a compound annual growth rate (CAGR) of 2.81%, derived from historical BLS wage trends for occupational therapy assistants (SOC 31-2011).
Compiled and verified by Jordan Lee, MS, OTR/L, a licensed occupational therapy assistant with 10+ years of clinical experience. · View source data at BLS.gov