Occupational Therapy Assistant Salary in Texas: $81,288 (2026)
Quick Answer:Across Texas's 109 metropolitan areas, the average median occupational therapy assistant pay sits at $81,288/year heading into 2026 — a figure projected from 2025 BLS OEWS wage data for SOC 31-2011. Because Texas sits at BEA RPP 96.0 (4% below the U.S. baseline), that statewide median translates to roughly $84,675 in nationally-comparable purchasing power. Highest-paying metros: Port Arthur ($84,503), San Marcos ($83,401), Beaumont ($82,610).
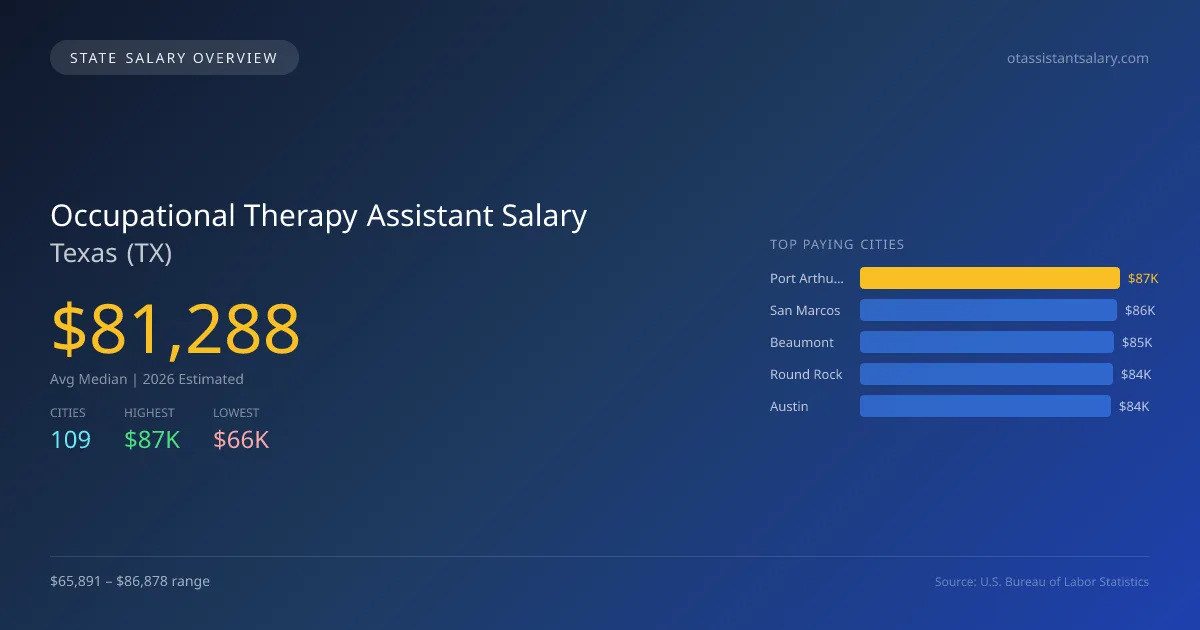
In Texas, occupational therapy assistants can expect an average median salary of $81,288 in 2026, which is notably higher than the national median of $74,332, reflecting a 9.4% advantage. Port Arthur leads with the highest salary at $86,878, while Laredo presents the lowest figure at $65,891, resulting in a salary gap of $20,987. This disparity can be attributed to factors such as local demand for services, cost of living, and the availability of healthcare facilities. Texas has specific state licensing requirements that occupational therapy assistants must meet, along with defined scope of practice laws, which can influence job desirability and salary levels. The job market demonstrates a stable outlook with a projected annual growth rate of 2.81%, indicating a steady demand for occupational therapy assistants. As the total employment of occupational therapy assistants in Texas is approximately 6,454, cities like San Marcos ($85,745), Beaumont ($84,931), Round Rock ($84,376), and Austin ($83,790) also offer competitive salaries, underlining the diverse opportunities across the state. Overall, Texas presents a dynamic landscape for occupational therapy assistants, supported by a growing job market and varied salary potential.
Texas Occupational Therapy Assistant Salary Range
Overall salary range in Texas: $35,881 (lowest entry-level) to $110,100 (highest top earner)
Texas vs National Average
Texas occupational therapy assistants earn 9.36% more than the national median (+$6,956/year difference).
Texas Occupational Therapy Assistant Salary Distribution (2026)
Occupational Therapy Assistant salaries in Texas range from $62,784 (entry-level, 10th percentile) to $97,312 (top earners, 90th percentile), with a median of $81,288. The Texas median is $6,956 above the US national median of $74,332. The average hourly rate is $39.08/hr. Approximately 6,454 occupational therapy assistants are employed across 109 cities.
2019 BLS Actual
$65,335
2025 BLS Actual
$79,066
2026 Current Est.
$81,288
2019–2027 Growth
+27.9%
Salary Trajectory for Occupational Therapy Assistants in Texas (2019–2027)
2019–2025: actual BLS OEWS data for this metro area. 2026+: CAGR 2.81% projection.
| Year | Annual Salary | Status |
|---|---|---|
| 2019 | $65,335 | Actual |
| 2020 | $67,994 | Actual |
| 2021 | $75,153 | Actual |
| 2022 | $76,190 | Actual |
| 2023 | $73,310 | Actual |
| 2024 | $75,998 | Actual |
| 2025 | $79,066 | Actual |
| 2026(current) | $81,288 | Estimated |
| 2027 | $83,572 | Projected |
Based on 7 years of BLS OEWS data for the Texas metropolitan area, the median occupational therapy assistant salary grew 21.0% from $65,335 (2019) to $79,066 (2025). At a 2.81% compound annual growth rate, salaries are projected to reach $83,572 by 2027 — a total increase of $18,237 (27.91%) from 2019.
Note: Historical values (2019–2025) are actual BLS OEWS figures for the Texas metropolitan area, sourced from annual Occupational Employment and Wage Statistics surveys. 2026–2026 figures are current estimates, and 2027 values are projections, calculated using a 2.81% CAGR derived from 7-year BLS historical data. Actual salaries may vary based on employer, experience, certifications, and local market conditions.
Top 5 Highest Paying Cities in Texas
Lowest Paying Cities in Texas
| City | Median Salary |
|---|---|
| Laredo | $65,891 |
| Tomball | $71,828 |
| Murphy | $72,405 |
| Horizon City | $72,894 |
| Stephenville | $73,212 |
Best Value Cities for Occupational Therapy Assistants in Texas
When adjusted for local cost of living, these Texas cities offer the most purchasing power for occupational therapy assistants.
| City | Nominal Salary | CoL Index | Adjusted Salary |
|---|---|---|---|
| Texarkana | $81,960 | 84.012 | $97,557 |
| Beaumont | $84,931 | 90.046 | $94,320 |
| Port Arthur | $86,878 | 96 | $90,498 |
| Lubbock | $81,929 | 91.317 | $89,719 |
| San Marcos | $85,745 | 96 | $89,318 |
Adjusted salary = nominal salary × (100 / CoL index). CoL index: 100 = national average. Lower index = lower cost of living.
Salary by Experience Level in Texas
| Experience Level | Estimated Annual |
|---|---|
| Entry Level (0-2 years) | $62,784 |
| Mid Career (3-7 years) | $81,288 |
| Experienced (7+ years) | $97,312 |
Estimates based on BLS percentile data averaged across Texas metro areas. Individual pay varies by employer, certifications, and specialization.
All 109 Cities in Texas
| # | City | Median Salary |
|---|---|---|
| 1 | Port Arthur | $86,878 |
| 2 | San Marcos | $85,745 |
| 3 | Beaumont | $84,931 |
| 4 | Round Rock | $84,376 |
| 5 | Austin | $83,790 |
| 6 | Houston | $83,626 |
| 7 | Dallas | $83,451 |
| 8 | Fort Worth | $82,907 |
| 9 | The Woodlands | $82,625 |
| 10 | Pasadena | $82,532 |
| 11 | New Braunfels | $82,174 |
| 12 | Irving | $82,087 |
| 13 | Texarkana | $81,960 |
| 14 | Lubbock | $81,929 |
| 15 | Plano | $81,816 |
| 16 | Arlington | $81,765 |
| 17 | San Antonio | $81,467 |
| 18 | Garland | $81,390 |
| 19 | Frisco | $81,100 |
| 20 | Conroe | $79,438 |
| 21 | Waco | $79,338 |
| 22 | Richardson | $79,290 |
| 23 | Carrollton | $79,278 |
| 24 | Grand Prairie | $79,145 |
| 25 | Amarillo | $78,876 |
| 26 | Galveston | $78,564 |
| 27 | DeSoto | $78,508 |
| 28 | Killeen | $78,434 |
| 29 | Missouri City | $78,428 |
| 30 | San Angelo | $78,405 |
| 31 | Abilene | $78,285 |
| 32 | Longview | $78,208 |
| 33 | Midland | $78,171 |
| 34 | Sugar Land | $78,094 |
| 35 | Allen | $78,088 |
| 36 | League City | $78,018 |
| 37 | Cedar Park | $77,983 |
| 38 | Georgetown | $77,956 |
| 39 | Baytown | $77,925 |
| 40 | Denton | $77,880 |
| 41 | Wylie | $77,869 |
| 42 | Cleburne | $77,858 |
| 43 | Mesquite | $77,848 |
| 44 | College Station | $77,796 |
| 45 | Temple | $77,790 |
| 46 | Pharr | $77,789 |
| 47 | McKinney | $77,778 |
| 48 | Pearland | $77,619 |
| 49 | Burleson | $77,566 |
| 50 | Odessa | $77,468 |
| 51 | Pflugerville | $77,466 |
| 52 | Cedar Hill | $77,432 |
| 53 | Tyler | $77,395 |
| 54 | Flower Mound | $77,243 |
| 55 | Kyle | $77,193 |
| 56 | Del Rio | $77,104 |
| 57 | Coppell | $76,922 |
| 58 | Forney | $76,801 |
| 59 | El Paso | $76,737 |
| 60 | Rowlett | $76,722 |
| 61 | The Colony | $76,606 |
| 62 | Anna | $76,576 |
| 63 | Wichita Falls | $76,542 |
| 64 | Corpus Christi | $76,521 |
| 65 | Huntsville | $76,491 |
| 66 | Mission | $76,468 |
| 67 | Mansfield | $76,250 |
| 68 | Weatherford | $76,236 |
| 69 | Euless | $76,201 |
| 70 | Weslaco | $76,150 |
| 71 | Hurst | $76,114 |
| 72 | Grapevine | $76,021 |
| 73 | Leander | $76,002 |
| 74 | Little Elm | $75,998 |
| 75 | Lancaster | $75,931 |
| 76 | North Richland Hills | $75,878 |
| 77 | Duncanville | $75,865 |
| 78 | McAllen | $75,792 |
| 79 | Victoria | $75,792 |
| 80 | Copperas Cove | $75,719 |
| 81 | Friendswood | $75,706 |
| 82 | Harlingen | $75,540 |
| 83 | Seguin | $75,391 |
| 84 | Rockwall | $75,288 |
| 85 | Corinth | $75,209 |
| 86 | Schertz | $75,142 |
| 87 | Corsicana | $75,079 |
| 88 | San Juan | $75,026 |
| 89 | Kingsville | $75,019 |
| 90 | Prosper | $75,002 |
| 91 | Sachse | $74,813 |
| 92 | Bastrop | $74,802 |
| 93 | Socorro | $74,673 |
| 94 | Eagle Pass | $74,534 |
| 95 | Keller | $74,424 |
| 96 | Sherman | $74,418 |
| 97 | Lufkin | $74,339 |
| 98 | Haltom City | $74,333 |
| 99 | Nacogdoches | $74,333 |
| 100 | Benbrook | $74,272 |
| 101 | Brownsville | $74,219 |
| 102 | University Park | $74,201 |
| 103 | Edinburg | $73,970 |
| 104 | Fredericksburg | $73,736 |
| 105 | Stephenville | $73,212 |
| 106 | Horizon City | $72,894 |
| 107 | Murphy | $72,405 |
| 108 | Tomball | $71,828 |
| 109 | Laredo | $65,891 |
More Texas Salary Data
Hourly Rates
Explore occupational therapy assistant hourly pay in Texas cities.
Entry Level
Starting salaries for new occupational therapy assistants.
Senior / Experienced
Top earner salaries for experienced occupational therapy assistants.
Compare Cities in Texas
View all comparisons →Explore More Occupational Therapy Assistant Salary Data
Frequently Asked Questions
How much do occupational therapy assistants make in Texas in 2026?
What is the highest paying city for occupational therapy assistants in Texas?
How does Texas occupational therapy assistant pay compare to the national average?
What is the entry-level occupational therapy assistant salary in Texas?
How many occupational therapy assistants are employed in Texas?
Which Texas city offers the best value for occupational therapy assistants?
Written by Jordan Lee, MS, OTR/L
Career Analyst
Jordan Lee has 10 years of experience as an occupational therapist. Their specialty is working with children with developmental disorders. They have worked in various healthcare settings including schools and rehabilitation facilities.
Methodology & Data Source
Statewide salary figures on this page are 2026 projections based on the Bureau of Labor Statistics Occupational Employment and Wage Statistics (OEWS) survey, May 2026 release. A 2.81% compound annual growth rate (CAGR), derived from 6-year national BLS wage trends, was applied to each metro area's reported salary to estimate current 2026 occupational therapy assistant compensation across Texas. State averages are employment-weighted across 109 metro areas — larger metro areas with more occupational therapy assistantscontribute proportionally more to the average, producing figures that better reflect typical compensation. Individual pay varies by city, employer, certifications, and experience.
Data Sources & Methodology
Source: BLS, OEWS, 7-year dataset (–). Per-city data from annual BLS metropolitan area surveys.
2026 figures are projected from 2025 BLS data using a compound annual growth rate (CAGR) of 2.81%, derived from historical BLS wage trends for occupational therapy assistants (SOC 31-2011).
Compiled and verified by Jordan Lee, MS, OTR/L, a licensed occupational therapy assistant with 10+ years of clinical experience. · View source data at BLS.gov