Occupational Therapy Assistant Salary in Virginia: $74,410 (2026)
Quick Answer:Across Virginia's 42 metropolitan areas, the average median occupational therapy assistant pay sits at $74,410/year heading into 2026 — a figure projected from 2025 BLS OEWS wage data for SOC 31-2011. Because Virginia sits at BEA RPP 103.2 (3% above the U.S. baseline), that statewide median translates to roughly $72,103 in nationally-comparable purchasing power. Highest-paying metros: Alexandria ($87,505), Charlottesville ($79,770), Lynchburg ($78,230).
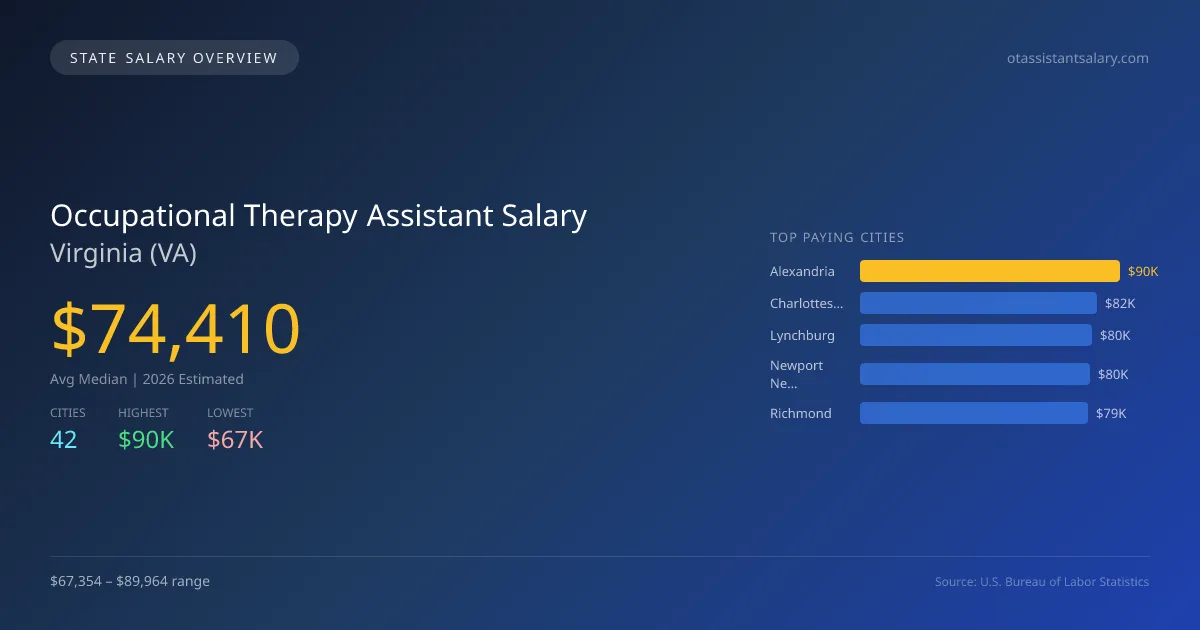
In 2026, the average median salary for occupational therapy assistants in Virginia is projected to be $74,410, which is slightly above the national median of $74,332, reflecting a competitive position in the job market with a difference of just 0.1%. The salary range across cities varies significantly, with Alexandria offering the highest average salary at $89,964, while Bristol is at the lower end with $67,354, creating a gap of $22,610. This disparity is influenced by factors such as cost of living, demand for therapy services, and the density of healthcare facilities. Virginia's licensing requirements and the defined scope of practice for occupational therapy assistants contribute to the evolving landscape in the state. The demand for these professionals is expected to grow, supported by an annual CAGR of 2.81% as projected through 2025 BLS data, indicating a steady influx of job opportunities. Key metropolitan areas like Charlottesville, Lynchburg, Newport News, and Richmond offer salaries ranging from $78,917 to $82,012, enhancing the appeal for prospective candidates. Overall, the job market for occupational therapy assistants in Virginia shows promising growth and competitive salary opportunities across various metropolitan areas.
Virginia Occupational Therapy Assistant Salary Range
Overall salary range in Virginia: $44,065 (lowest entry-level) to $114,617 (highest top earner)
Virginia vs National Average
Virginia occupational therapy assistants earn 0.10% more than the national median (+$78/year difference).
Virginia Occupational Therapy Assistant Salary Distribution (2026)
Occupational Therapy Assistant salaries in Virginia range from $55,912 (entry-level, 10th percentile) to $91,710 (top earners, 90th percentile), with a median of $74,410. The Virginia median is $78 above the US national median of $74,332. The average hourly rate is $35.77/hr. Approximately 1,137 occupational therapy assistants are employed across 42 cities.
2019 BLS Actual
$69,640
2025 BLS Actual
$72,376
2026 Current Est.
$74,410
2019–2027 Growth
+9.9%
Salary Trajectory for Occupational Therapy Assistants in Virginia (2019–2027)
2019–2025: actual BLS OEWS data for this metro area. 2026+: CAGR 2.81% projection.
| Year | Annual Salary | Status |
|---|---|---|
| 2019 | $69,640 | Actual |
| 2020 | $70,771 | Actual |
| 2021 | $63,518 | Actual |
| 2022 | $67,213 | Actual |
| 2023 | $71,834 | Actual |
| 2024 | $71,454 | Actual |
| 2025 | $72,376 | Actual |
| 2026(current) | $74,410 | Estimated |
| 2027 | $76,501 | Projected |
Based on 7 years of BLS OEWS data for the Virginia metropolitan area, the median occupational therapy assistant salary grew 3.9% from $69,640 (2019) to $72,376 (2025). At a 2.81% compound annual growth rate, salaries are projected to reach $76,501 by 2027 — a total increase of $6,861 (9.85%) from 2019.
Note: Historical values (2019–2025) are actual BLS OEWS figures for the Virginia metropolitan area, sourced from annual Occupational Employment and Wage Statistics surveys. 2026–2026 figures are current estimates, and 2027 values are projections, calculated using a 2.81% CAGR derived from 7-year BLS historical data. Actual salaries may vary based on employer, experience, certifications, and local market conditions.
Top 5 Highest Paying Cities in Virginia
Lowest Paying Cities in Virginia
| City | Median Salary |
|---|---|
| Bristol | $67,354 |
| Virginia Beach | $67,577 |
| Chesapeake | $67,839 |
| Norfolk | $68,586 |
| Falls Church | $72,767 |
Best Value Cities for Occupational Therapy Assistants in Virginia
When adjusted for local cost of living, these Virginia cities offer the most purchasing power for occupational therapy assistants.
| City | Nominal Salary | CoL Index | Adjusted Salary |
|---|---|---|---|
| Lynchburg | $80,428 | 89.363 | $90,001 |
| Alexandria | $89,964 | 103.2 | $87,174 |
| Charlottesville | $82,012 | 99.146 | $82,718 |
| Richmond | $78,917 | 97.858 | $80,644 |
| Roanoke | $74,918 | 93.618 | $80,025 |
Adjusted salary = nominal salary × (100 / CoL index). CoL index: 100 = national average. Lower index = lower cost of living.
Salary by Experience Level in Virginia
| Experience Level | Estimated Annual |
|---|---|
| Entry Level (0-2 years) | $55,912 |
| Mid Career (3-7 years) | $74,410 |
| Experienced (7+ years) | $91,710 |
Estimates based on BLS percentile data averaged across Virginia metro areas. Individual pay varies by employer, certifications, and specialization.
All 42 Cities in Virginia
| # | City | Median Salary |
|---|---|---|
| 1 | Alexandria | $89,964 |
| 2 | Charlottesville | $82,012 |
| 3 | Lynchburg | $80,428 |
| 4 | Newport News | $79,531 |
| 5 | Richmond | $78,917 |
| 6 | Hampton | $78,830 |
| 7 | Centreville | $78,463 |
| 8 | Blacksburg | $78,267 |
| 9 | Burke | $77,930 |
| 10 | Harrisonburg | $77,769 |
| 11 | Suffolk | $77,594 |
| 12 | Tuckahoe | $77,373 |
| 13 | Ashburn | $77,262 |
| 14 | McLean | $77,257 |
| 15 | Reston | $77,174 |
| 16 | Danville | $77,159 |
| 17 | Fredericksburg | $76,828 |
| 18 | Dale City | $76,812 |
| 19 | Manassas | $76,730 |
| 20 | Salem | $76,515 |
| 21 | Leesburg | $76,406 |
| 22 | Portsmouth | $76,362 |
| 23 | Mechanicsville | $76,240 |
| 24 | Springfield | $75,970 |
| 25 | Woodbridge | $75,867 |
| 26 | Sterling | $75,720 |
| 27 | Staunton | $75,664 |
| 28 | Lake Ridge | $75,622 |
| 29 | Linton Hall | $75,536 |
| 30 | Radford | $75,479 |
| 31 | Fairfax | $75,342 |
| 32 | Waynesboro | $74,974 |
| 33 | Roanoke | $74,918 |
| 34 | Annandale | $74,874 |
| 35 | Winchester | $74,764 |
| 36 | Williamsburg | $74,731 |
| 37 | Herndon | $73,923 |
| 38 | Falls Church | $72,767 |
| 39 | Norfolk | $68,586 |
| 40 | Chesapeake | $67,839 |
| 41 | Virginia Beach | $67,577 |
| 42 | Bristol | $67,354 |
More Virginia Salary Data
Hourly Rates
Explore occupational therapy assistant hourly pay in Virginia cities.
Entry Level
Starting salaries for new occupational therapy assistants.
Senior / Experienced
Top earner salaries for experienced occupational therapy assistants.
Compare Cities in Virginia
View all comparisons →Explore More Occupational Therapy Assistant Salary Data
Frequently Asked Questions
How much do occupational therapy assistants make in Virginia in 2026?
What is the highest paying city for occupational therapy assistants in Virginia?
How does Virginia occupational therapy assistant pay compare to the national average?
What is the entry-level occupational therapy assistant salary in Virginia?
How many occupational therapy assistants are employed in Virginia?
Which Virginia city offers the best value for occupational therapy assistants?
Written by Jordan Lee, MS, OTR/L
Career Analyst
Jordan Lee has 10 years of experience as an occupational therapist. Their specialty is working with children with developmental disorders. They have worked in various healthcare settings including schools and rehabilitation facilities.
Methodology & Data Source
Statewide salary figures on this page are 2026 projections based on the Bureau of Labor Statistics Occupational Employment and Wage Statistics (OEWS) survey, May 2026 release. A 2.81% compound annual growth rate (CAGR), derived from 6-year national BLS wage trends, was applied to each metro area's reported salary to estimate current 2026 occupational therapy assistant compensation across Virginia. State averages are employment-weighted across 42 metro areas — larger metro areas with more occupational therapy assistantscontribute proportionally more to the average, producing figures that better reflect typical compensation. Individual pay varies by city, employer, certifications, and experience.
Data Sources & Methodology
Source: BLS, OEWS, 7-year dataset (–). Per-city data from annual BLS metropolitan area surveys.
2026 figures are projected from 2025 BLS data using a compound annual growth rate (CAGR) of 2.81%, derived from historical BLS wage trends for occupational therapy assistants (SOC 31-2011).
Compiled and verified by Jordan Lee, MS, OTR/L, a licensed occupational therapy assistant with 10+ years of clinical experience. · View source data at BLS.gov